
How to add and use a breakpoint in XCode

A step by step guide on adding, stopping and analyzing an iOS, MacOS, TVOS or WatchOS app at a breakpoint using XCode.
Step One: Add the Breakpoint
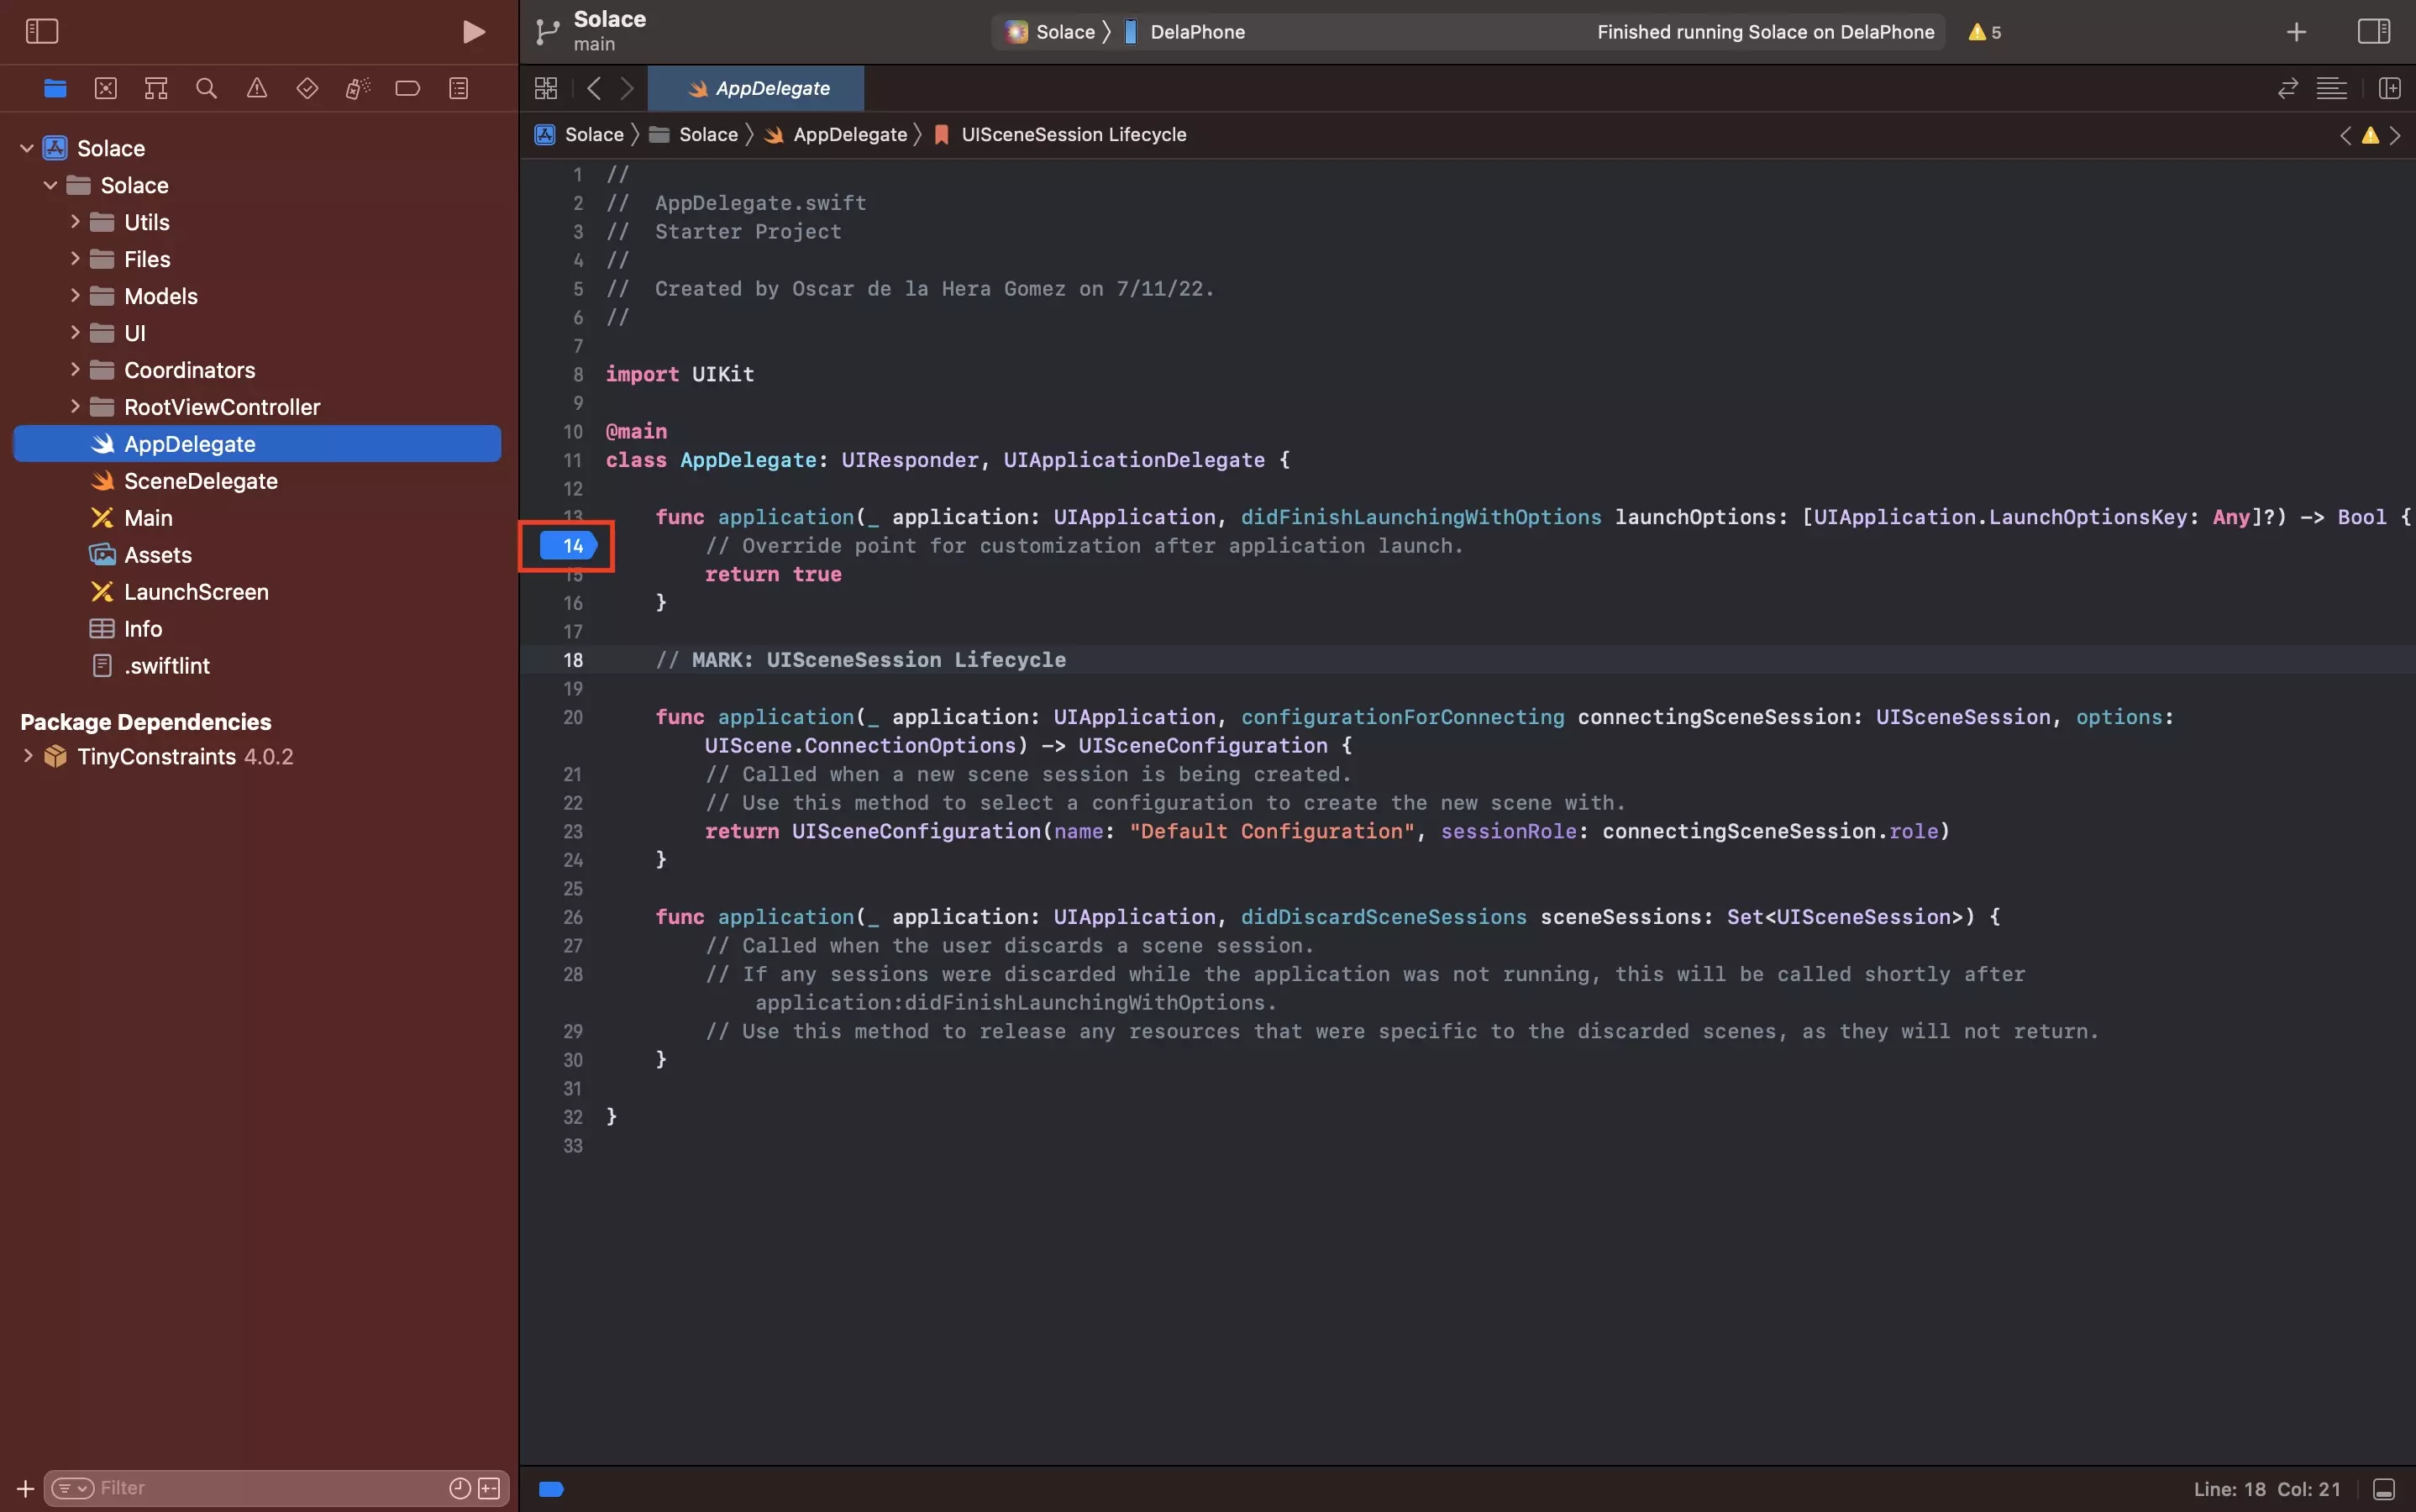
Open the relevant file and click the line number that you wish to add a breakpoint to.
After clicking, a visual should appear on the line similar to that above, which indicates that you have an active breakpoint in that file at that line.
Step Two: Run
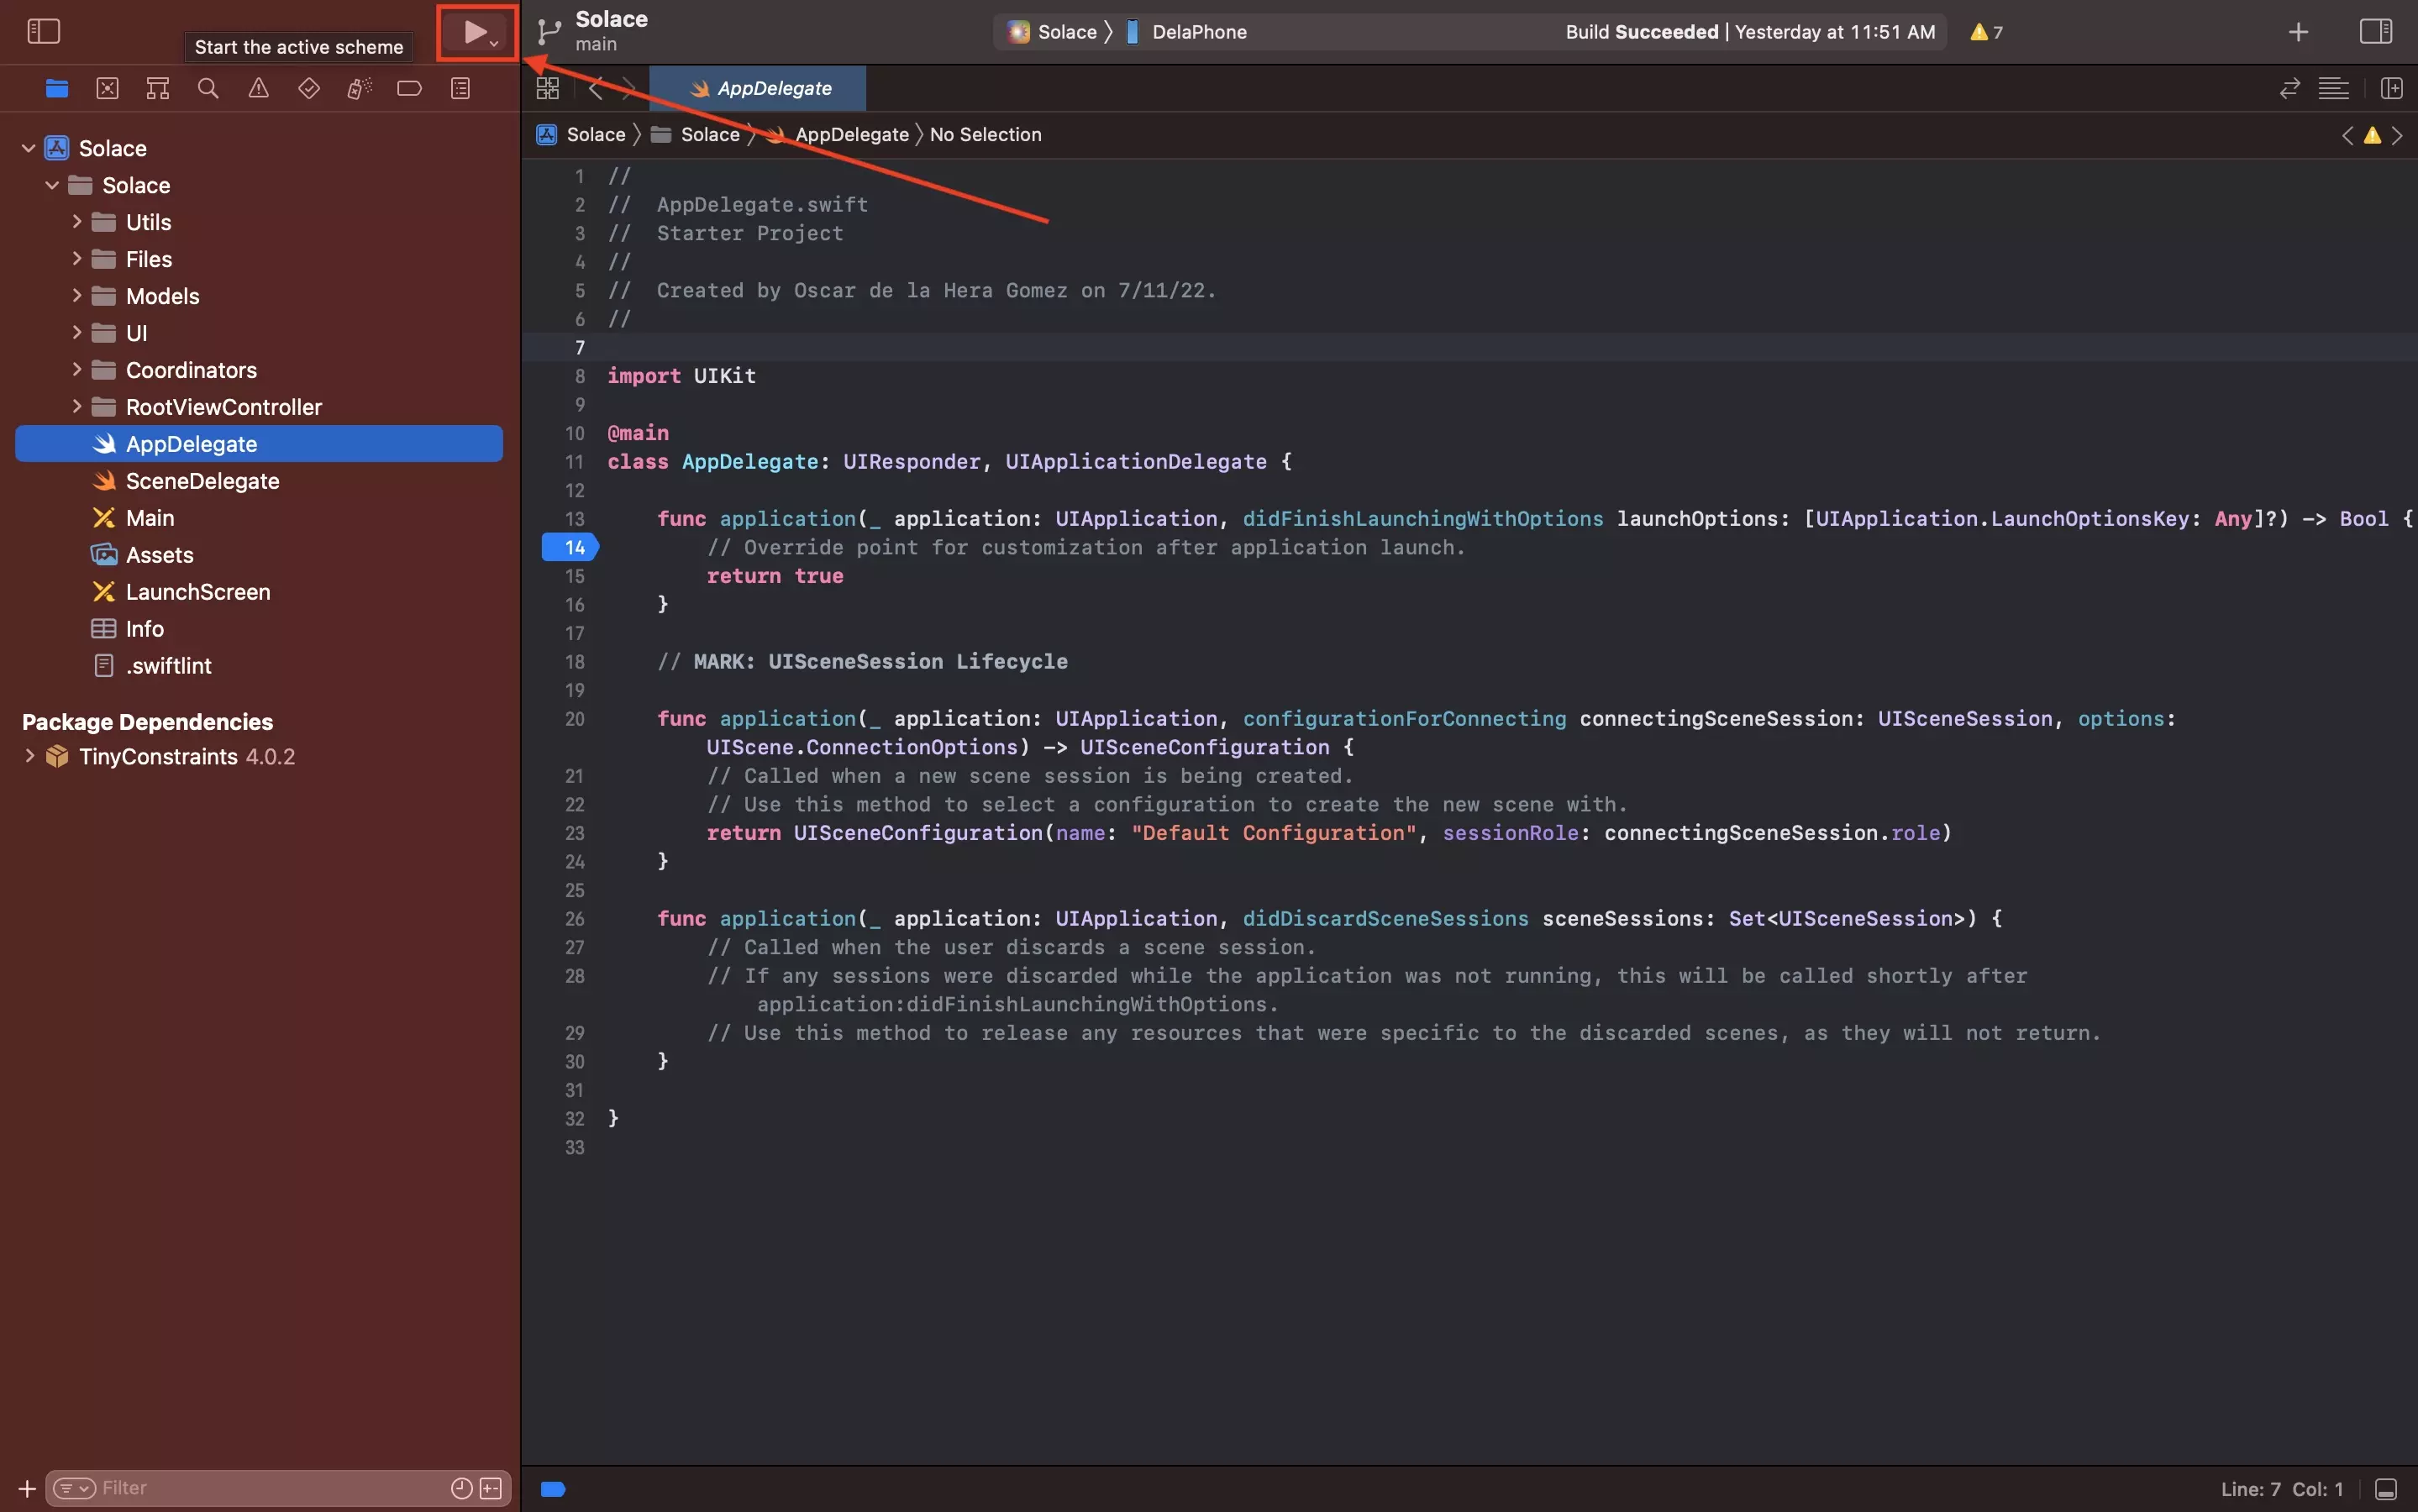
Press the Play button on the top left of Xcode, or press Command + R on your keyboard.
Step Three: Analyze
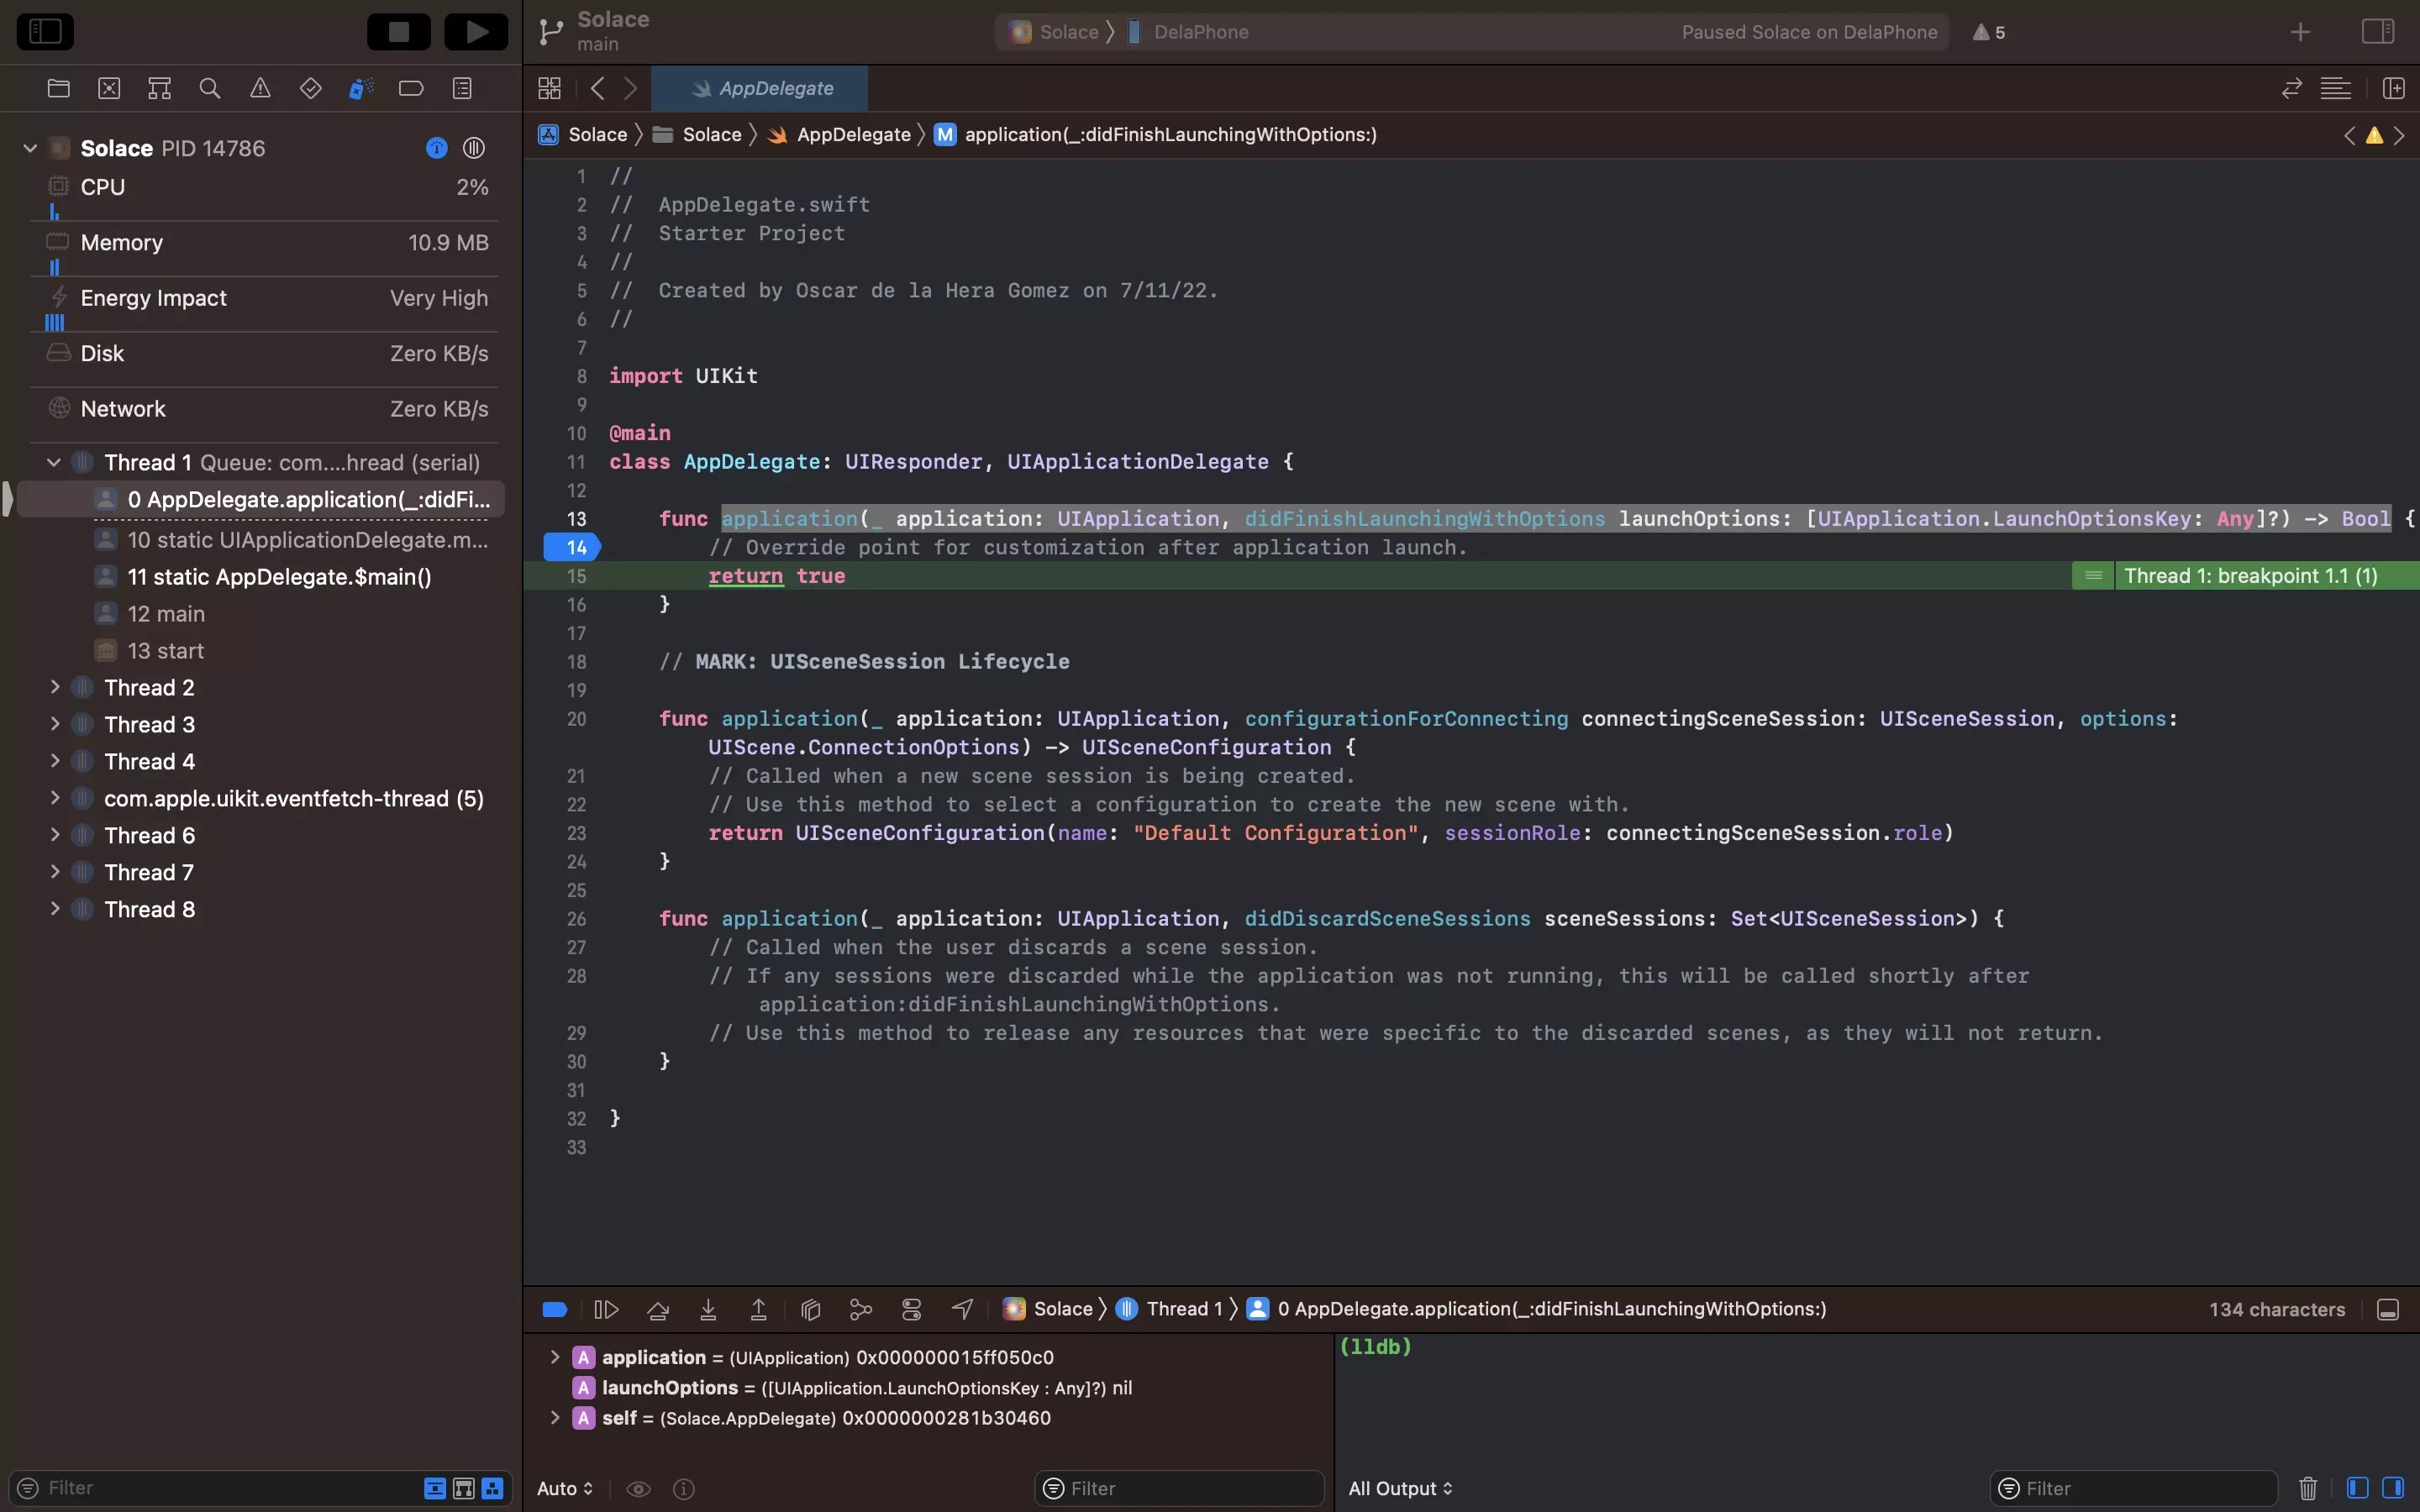
Perform the necessary actions to trigger the breakpoint.
When the code crosses this line, XCode will stop and give you insight into how the app is operating at that breakpoint.
At this point you can carry out multiple actions, including:
A | Inspect Variables
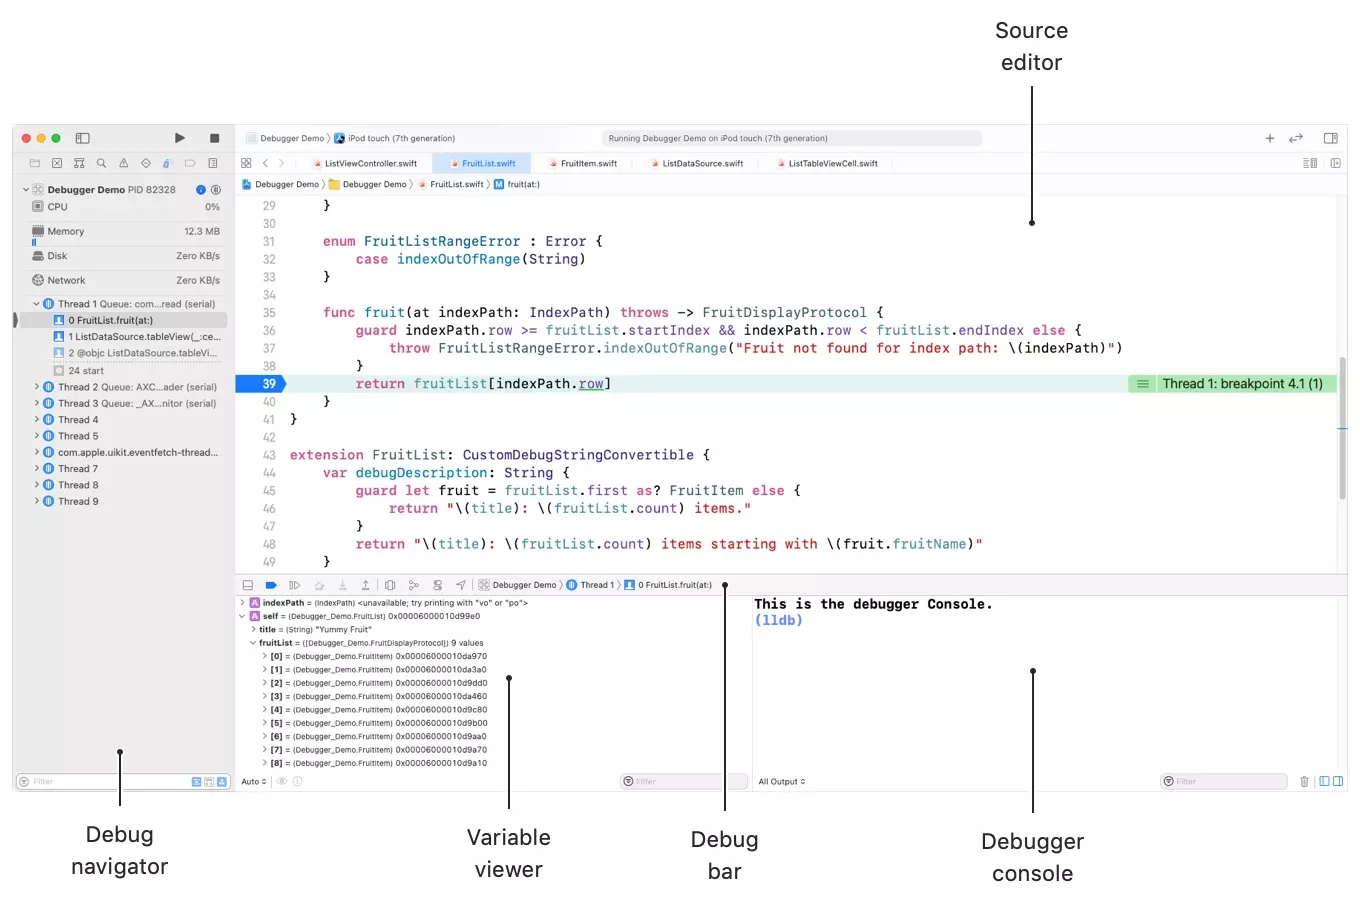
Inspect relevant app variables using the variable viewer that appears on the bottom left.
B | Continue, Step Over, Step Into, Step Out, Debug View Hierarchy, Debug Memory Graph, Apply Environment Overrides or Simulate Location
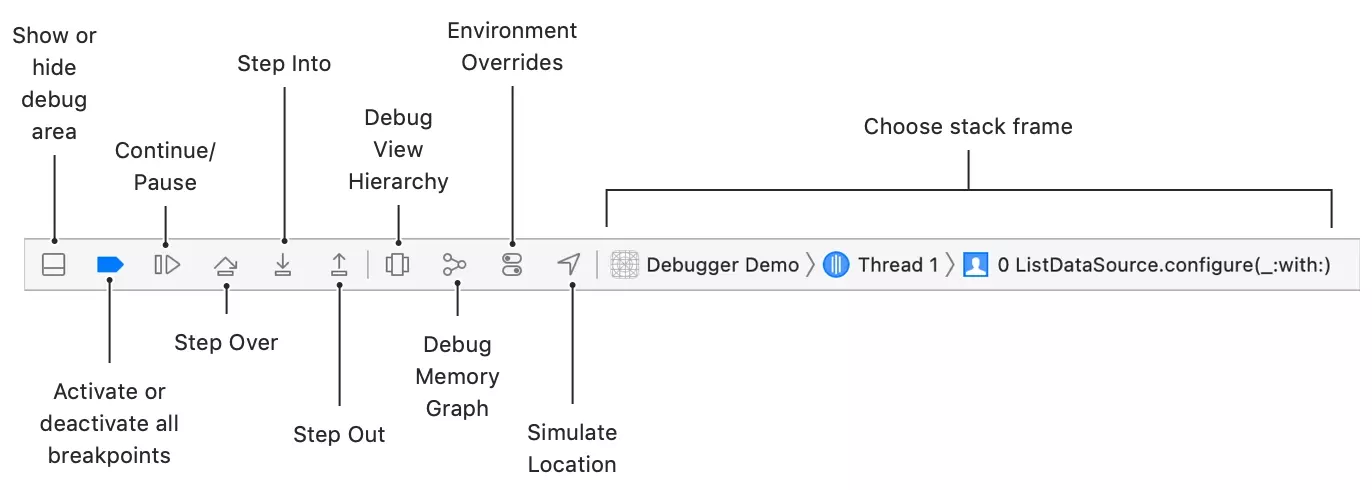
Using the Debug Bar above the variable viewer on the bottom left, carry out breakpoint specific actions that include:
- Continue Program Execution (Play Button) - This makes the app continue and essentially means that you don't want to continue analyzing the app at the breakpoint.
- Step Over (Triangular Arrow) - Run the next line of code in the same function. If the next line is the last, it will perform the equivalent of Continue Program Execution.
- Step Into (Down Arrow) - Run the next line of code. If the next instruction is inside another method or function, the debugger jumps to that function and continues executing it each time you click the Step Into button.
- Step Out (Up Arrow) - Skip the rest of the function and return to the next instruction in the calling function or method after using Step Into.
Please note that as you step through your app, inspect variables relevant to your bug and watch for unexpected values.
Other debug actions that appear on this bar include:
- Debug View Hierarchy (Screens) - Allows you to analyze the view hierarchy and all the UI objects that are currently active in the app.
- Debug Memory Graph (Share) - Allows you to analyze the memory of the app and how everything connects.
- Environment Overrides (Switches) - Allows you to override environment variables.
- Simulate Location (Arrow) - Allows you to change the simulated location (i.e. Change to Paris vs Madrid).